How to: Debug a Custom Index Connector
Posted
Wednesday, September 8, 2010 11:17 AM
by
CoreyRoth
I have been researching Custom Index Connectors in SharePoint 2010 over the past few weeks. I have been working with the MyFileConnector sample provided in the SDK, but after I made some changes, I realized it wasn’t immediately obvious how to debug my code. Luckily, @mwiselka helped me out and pointed me in the right direction. When it comes to debugging an index connector, timing is critical as well as picking the right process. In this case it’s not a matter of picking the right w3wp.exe process. It’s a matter of picking the right search process. If you don’t do the process right, your symbols will never be loaded and your break point will never be hit.
To get started, compile your connector and copy the assembly to the GAC. Now you need to restart the search service. It is critical that you restart the service any time you make a change or try to debug again. I would also do an iisreset as this seems to be required as well most of the time. If this is your first time installing the custom index connector be sure and follow all of the steps in the SDK which includes making registry changes and configuring the content source. I usually restart the service from PowerShell or a command prompt.
net stop osearch14
net start osearch14
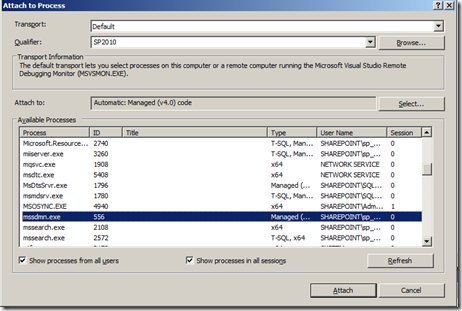
The process we need to debug is called mssdmn.exe. When you restart the service you will only see one of these listed in your processes list.

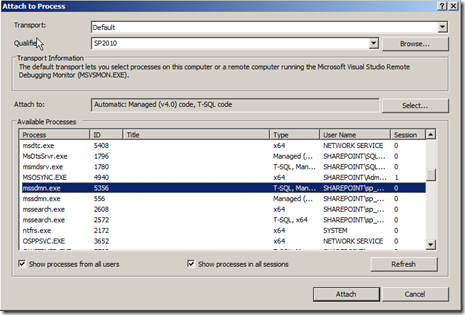
You may be tempted to attach to that process right away and kick off a full crawl of your new content source. Don’t do that. It will not work. When you kick off your first crawl, a second instance of mssdmn.exe is launched. That is the process you attach to. I remind you that timing is critical. After you start the crawl, you need to refresh the process list quickly and attach it if you are trying to catch something early in the process. It really just depends on the speed of your server, sometimes it takes quite a while for the process to show up.

Notice the new process listed. Once you attach to the correct process, you should have no issue with your breakpoint being hit.

Now, you might be thinking, I’ll just wait and attach to all mssdmn.exe processes that show up. I thought that might work but it doesn’t. What I have found is that any time you attach to the original mssdmn.exe process, it causes your breakpoint not to be hit. I have no idea why it behaves this way, but from what I have seen so far, you only attach to the newly spawned mssdmn.exe process. If you are having trouble getting the timing right, one thing that @mwiselka recommended was to start a crawl of another content source to spawn the mssdmn.exe process and attach to it. Then when you do your crawl, it should use the same spawned process.
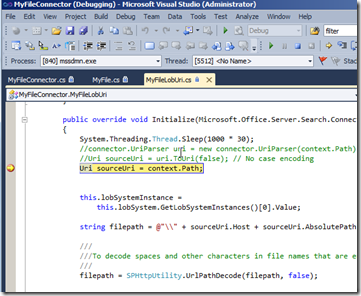
You would think that you could use something like System.Diagnostics.Debugger.Launch() like I have done with features, but I have had no luck getting that to work. You can see from my code snippet above, that adding a Thread.Sleep() can be a useful way to buy yourself time to attach to the process as well. It’s kind of hack, but it does seem to work. If the above technique doesn’t work, try it again. Recompile, restart osearch14, and iisreset. This technique can also be used with regular BCS Custom Connectors as well if you want to debug them while indexing.